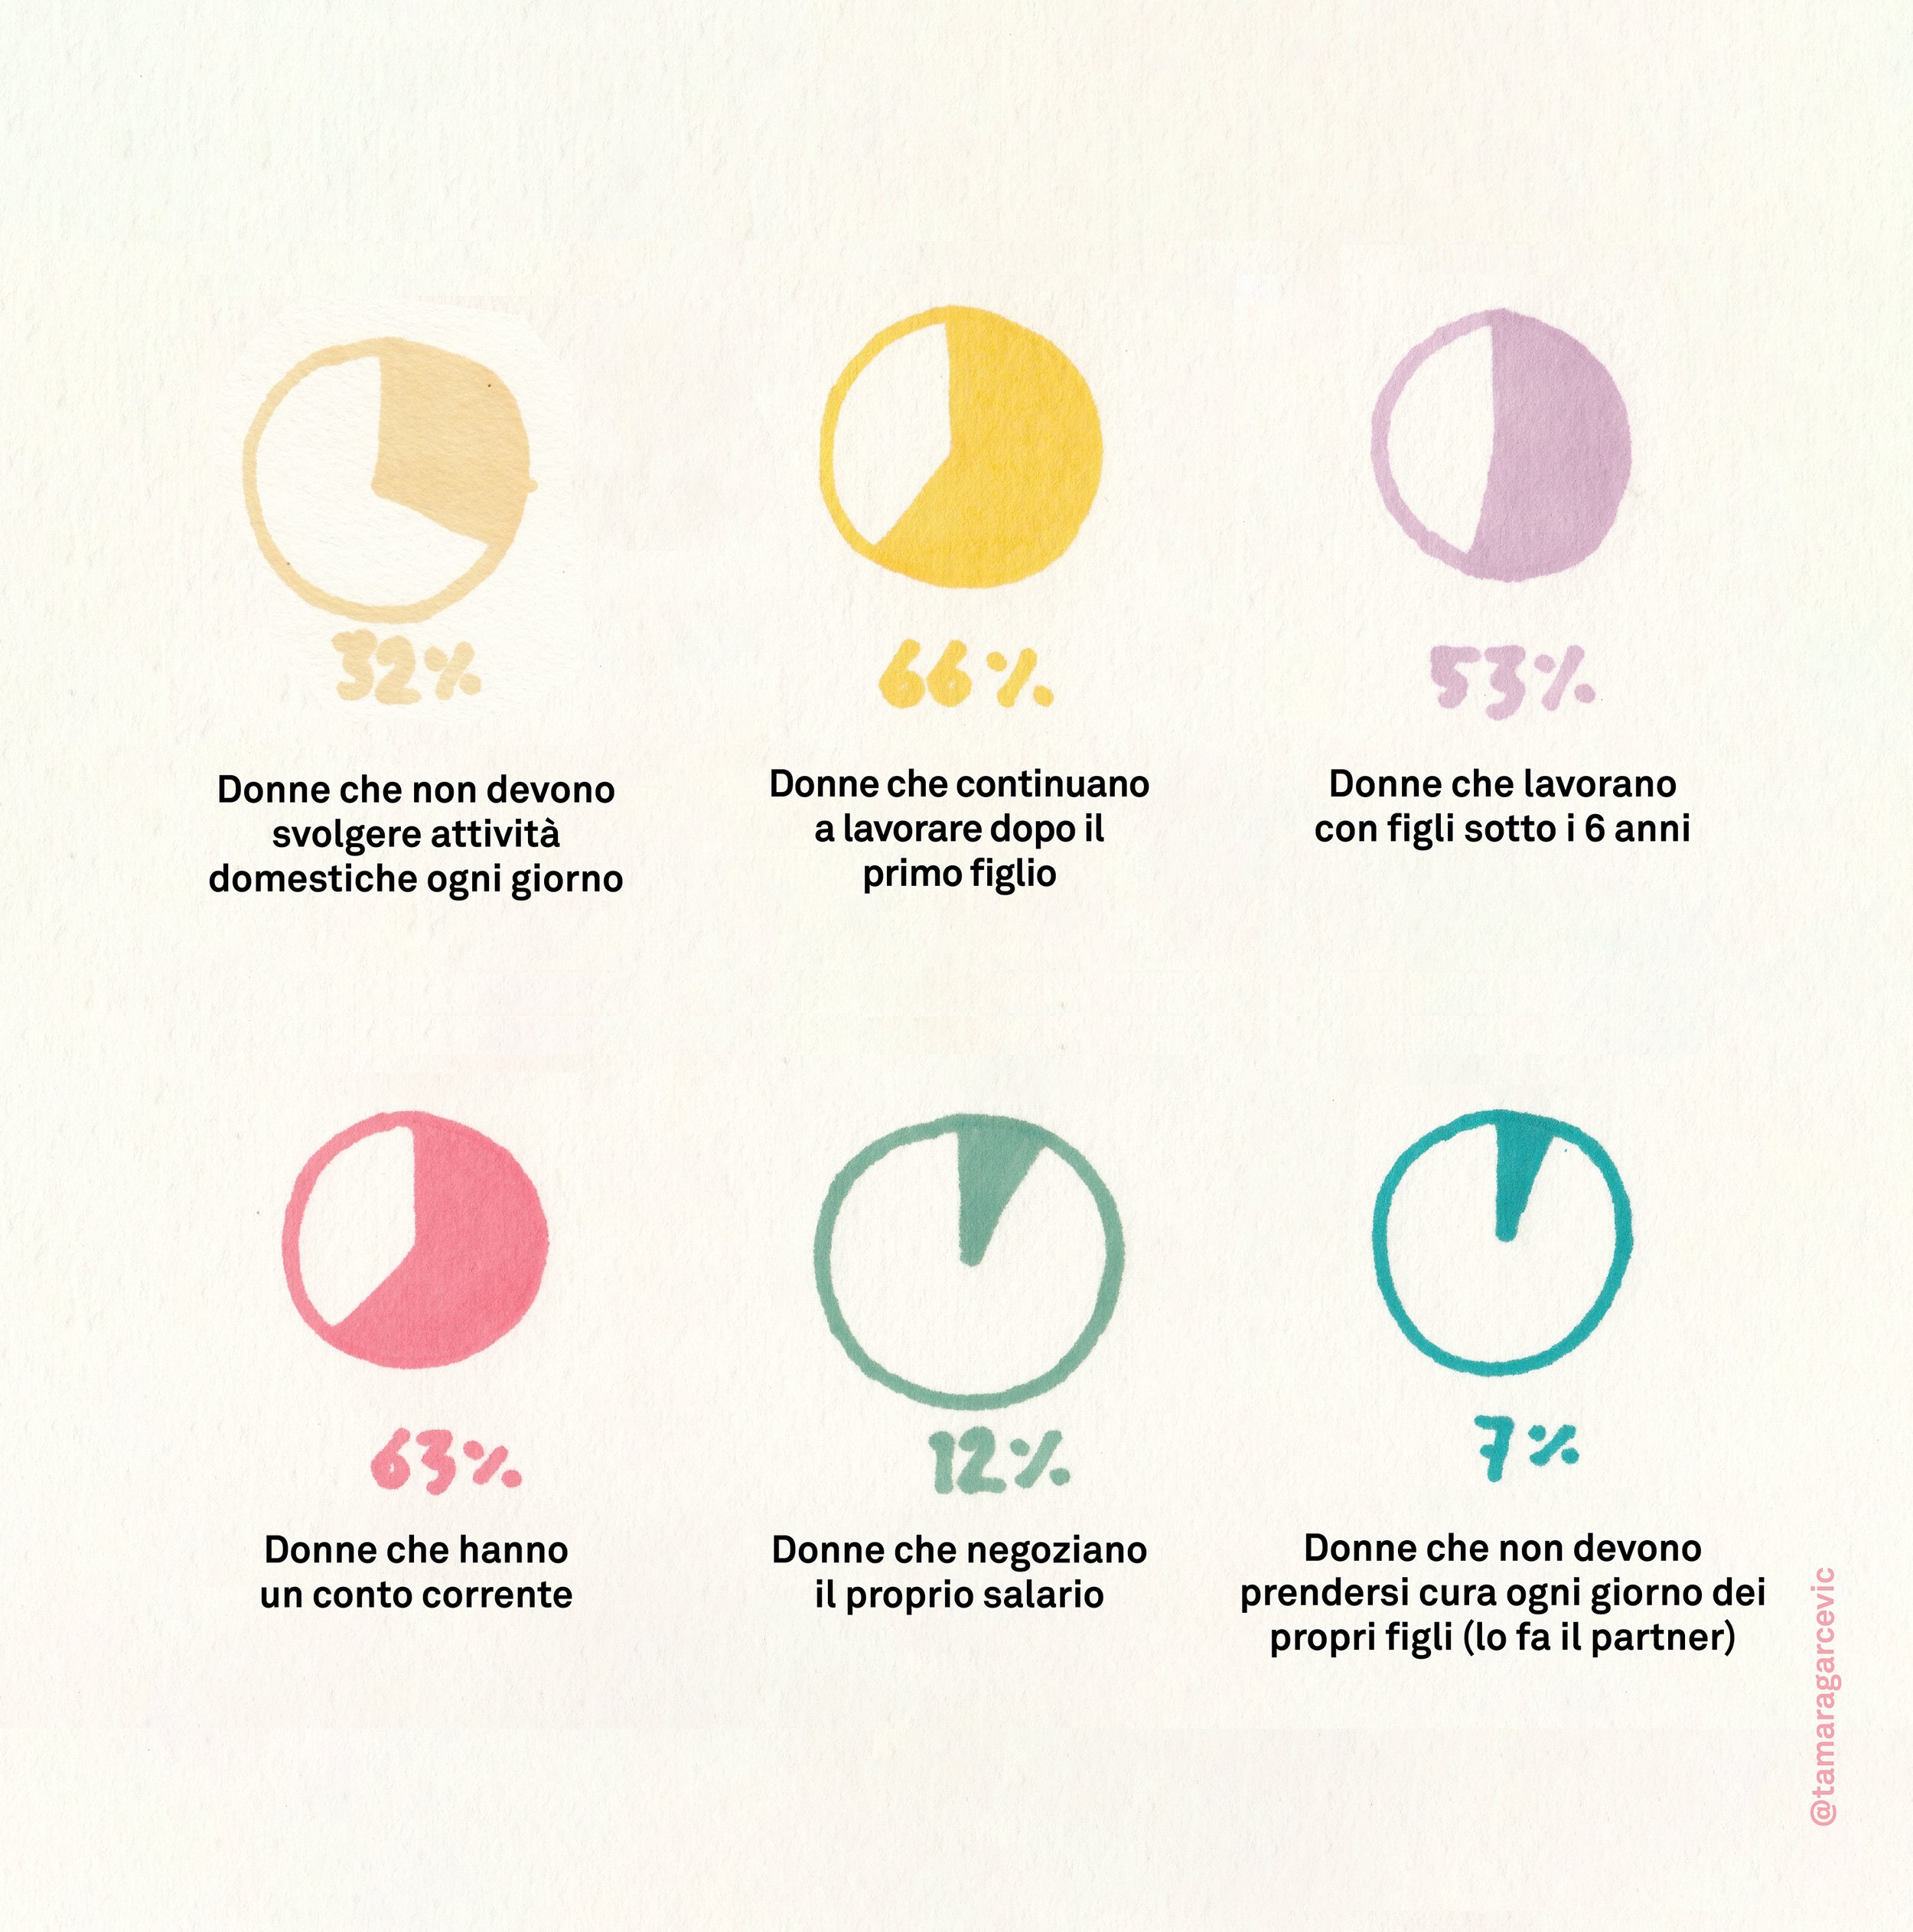
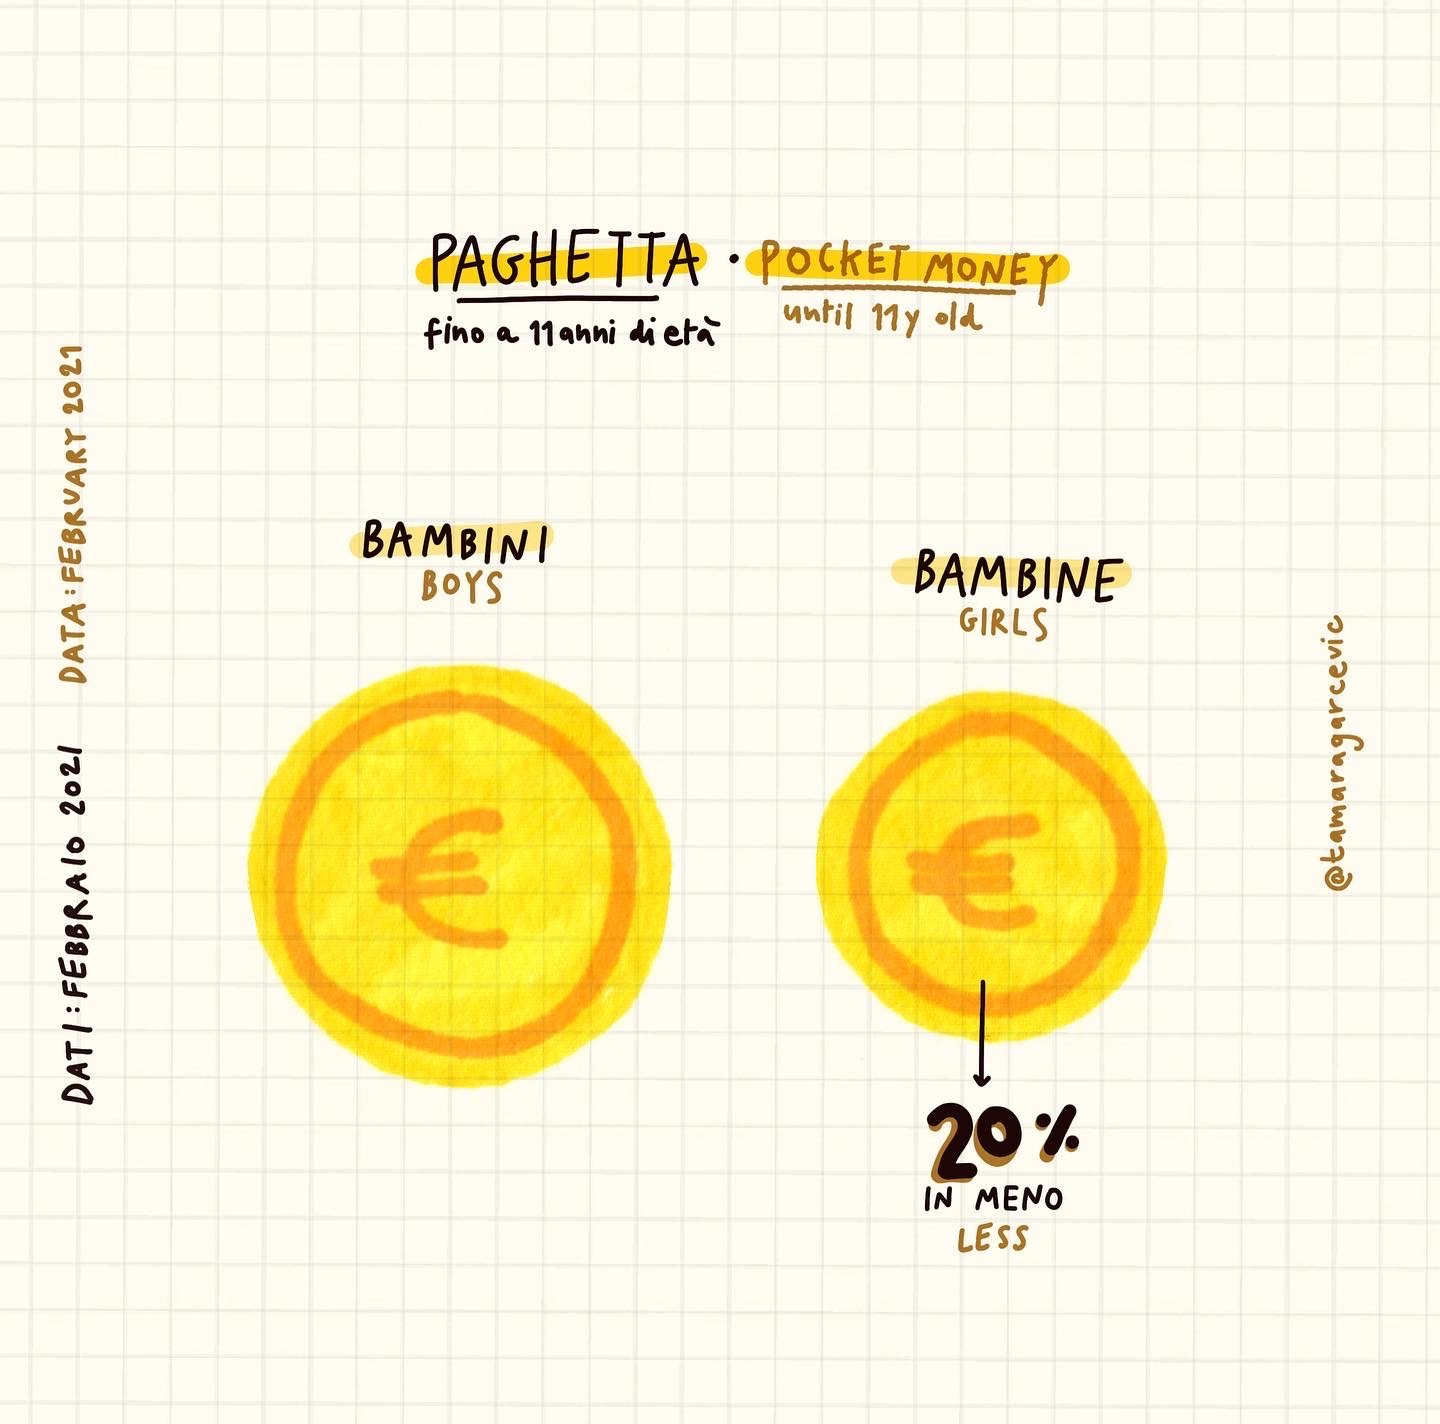
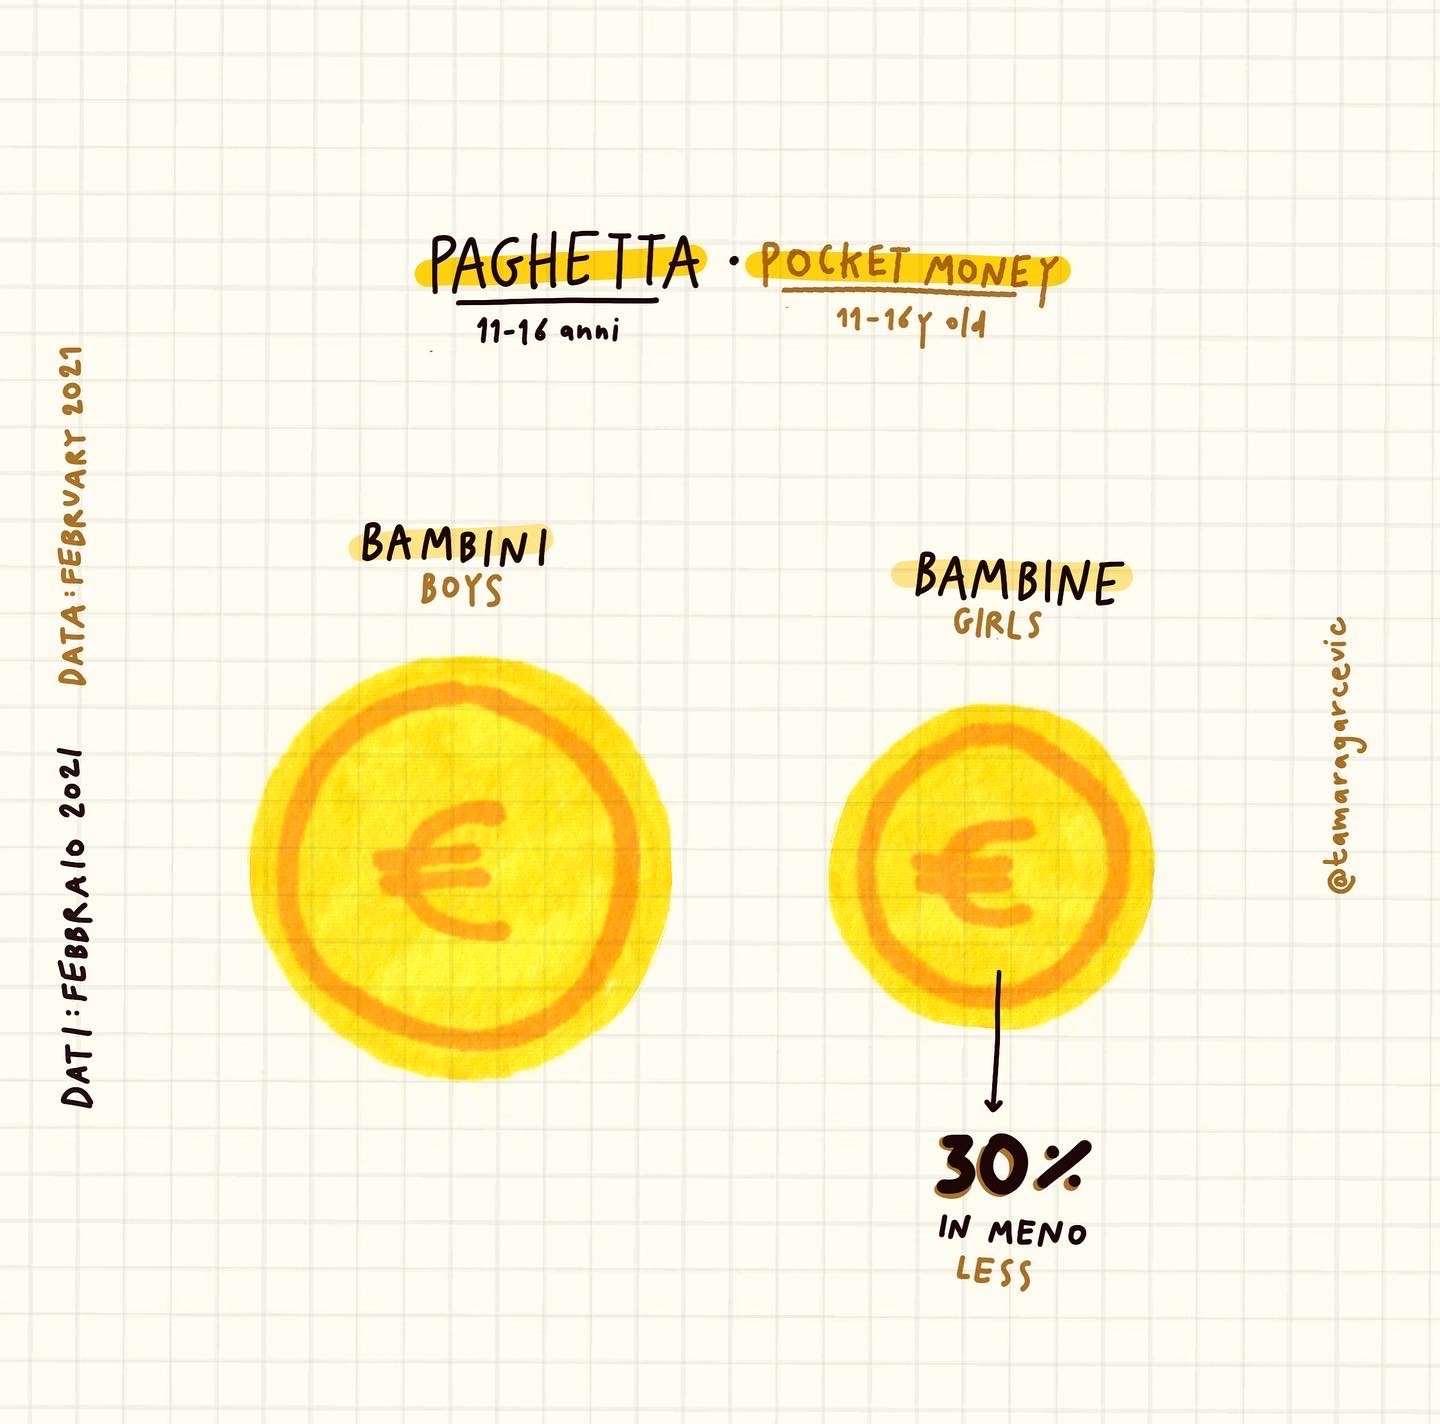
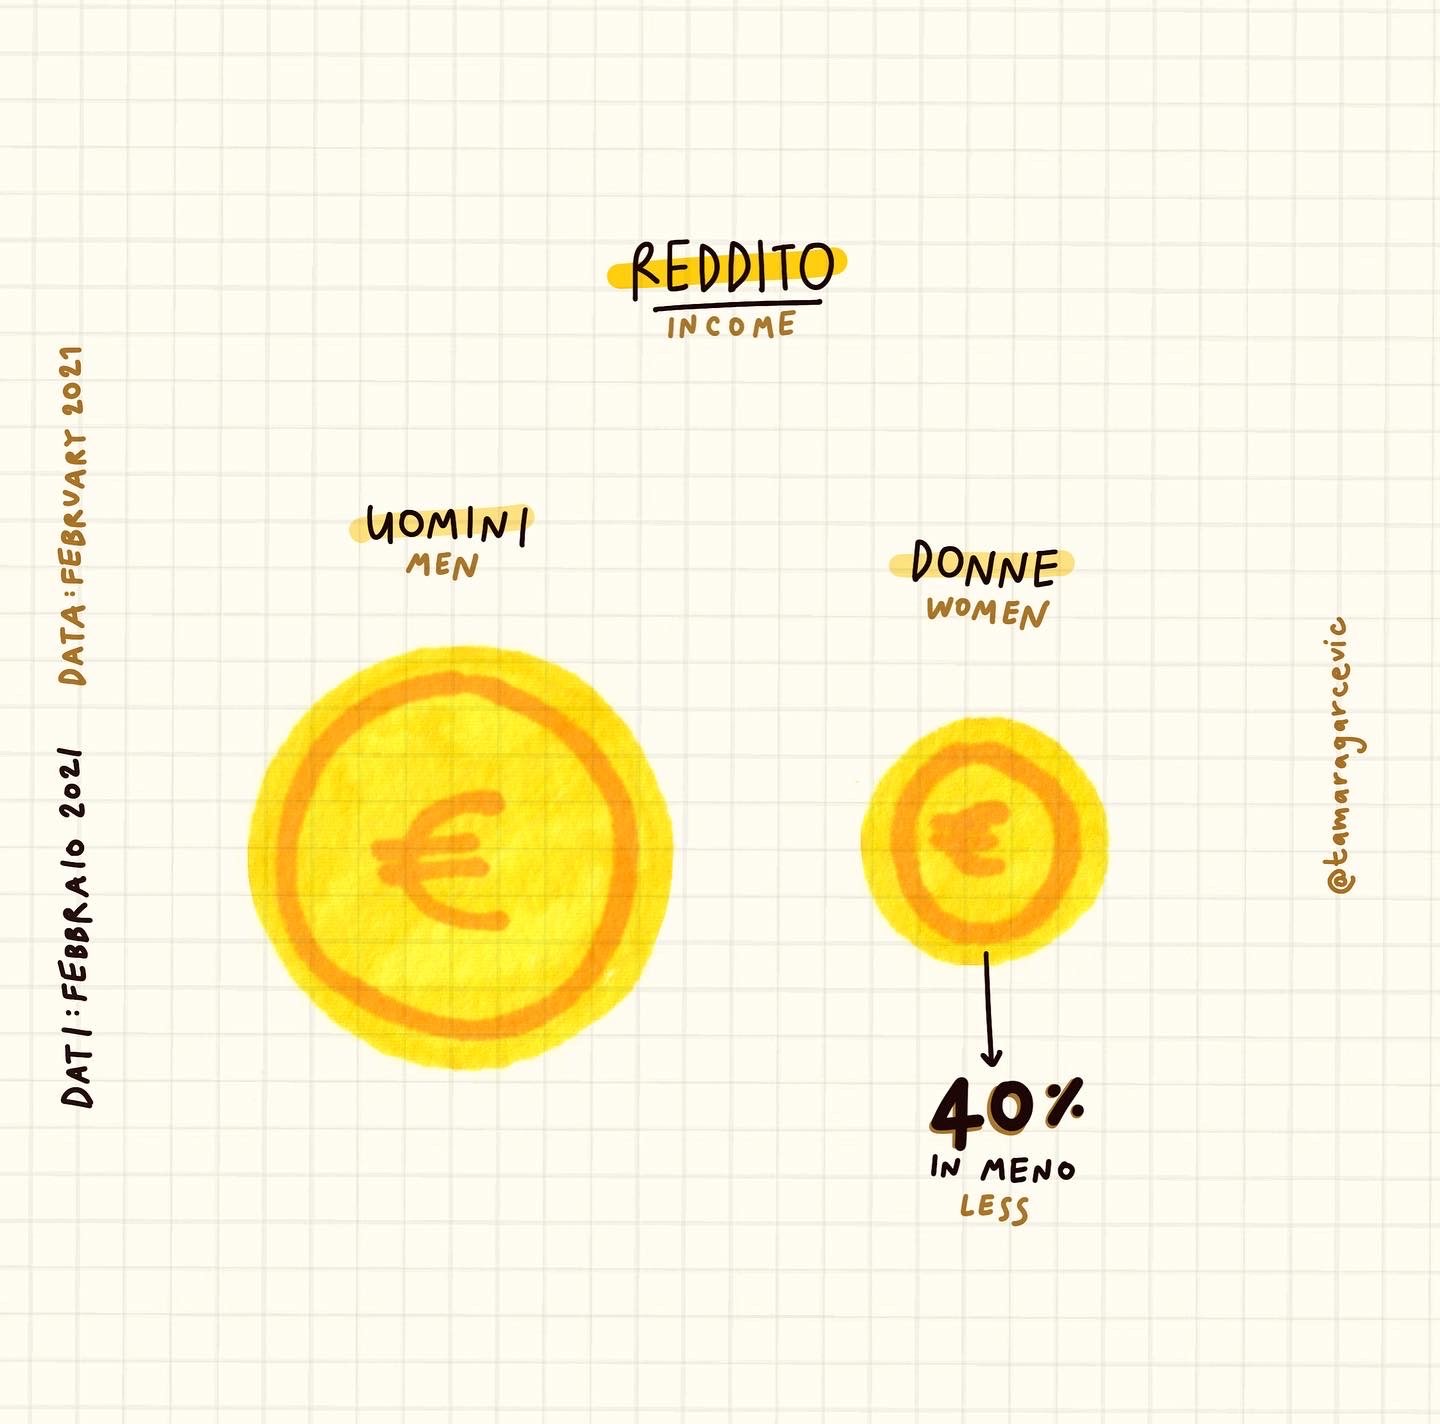
Paghetta scorretta.
Information & Data Illustration

Exploration, analysis, and creation of custom visuals to communicate complex data and information about gender-based income disparity in Italy.

Hand-drawn infographic comparing boys' and girls' piggy banks, with notes on age limits, date, and Instagram handle.
A handwritten infographic explaining how to reduce pocket money by 30% through discount on boys' and girls' allowances, with sketches of euro currency symbols.
A hand-drawn infographic on graph paper showing data about Reddit income in February 2021. It compares income between men and women, with men earning 40% more than women, represented by two yellow and orange circles with Euro symbols, and the date and the contact handle @tomarygreciuc are written along the sides.
Diagram with colored lines connecting to lists of text in Italian, focusing on women, children, and household activities.

Design (2022)
Data: Azzurra Rinaldi (2021)

Colorful pie charts depicting percentages of women based on their activities, including not performing domestic chores, continuing to work after their first child, working with children under six, having a current account, negotiating their salary, and not caring for their children daily.

Money privilege / or lack of
for Italian women