Information & Data Illustration

Exploration, analysis and creation of custom-made visuals
to communicate complex data and information.

Alzheimer research budget

Research and design (2023)
Sourche: whamnow.org US

Two torn pieces of brown paper with handwritten text. The left piece reads 'Alzheimer Patients: 33% Male, 66% Female.' The right piece reads 'Alzheimer Research Budget Breakdown: 12% Female Focused, 88% Male Focused.'

Yearly maternal deaths
caused by unsafe abortions

Research and design (2023)
Source: “Seeing the Unseen: The case for actionin the neglected crisis of unintended pregnancy”

A section of a colorful illustrated infographic with overlapping circles in red for female and blue for male. The background is beige with a grid pattern, and there are handwritten notes and labels in black. Related to data research on funding.
illustrated infographic by tamara garcevic with pink background showing statistics about maternal deaths related to pregnancy, with illustrations of a pregnant woman and text highlighting key data.

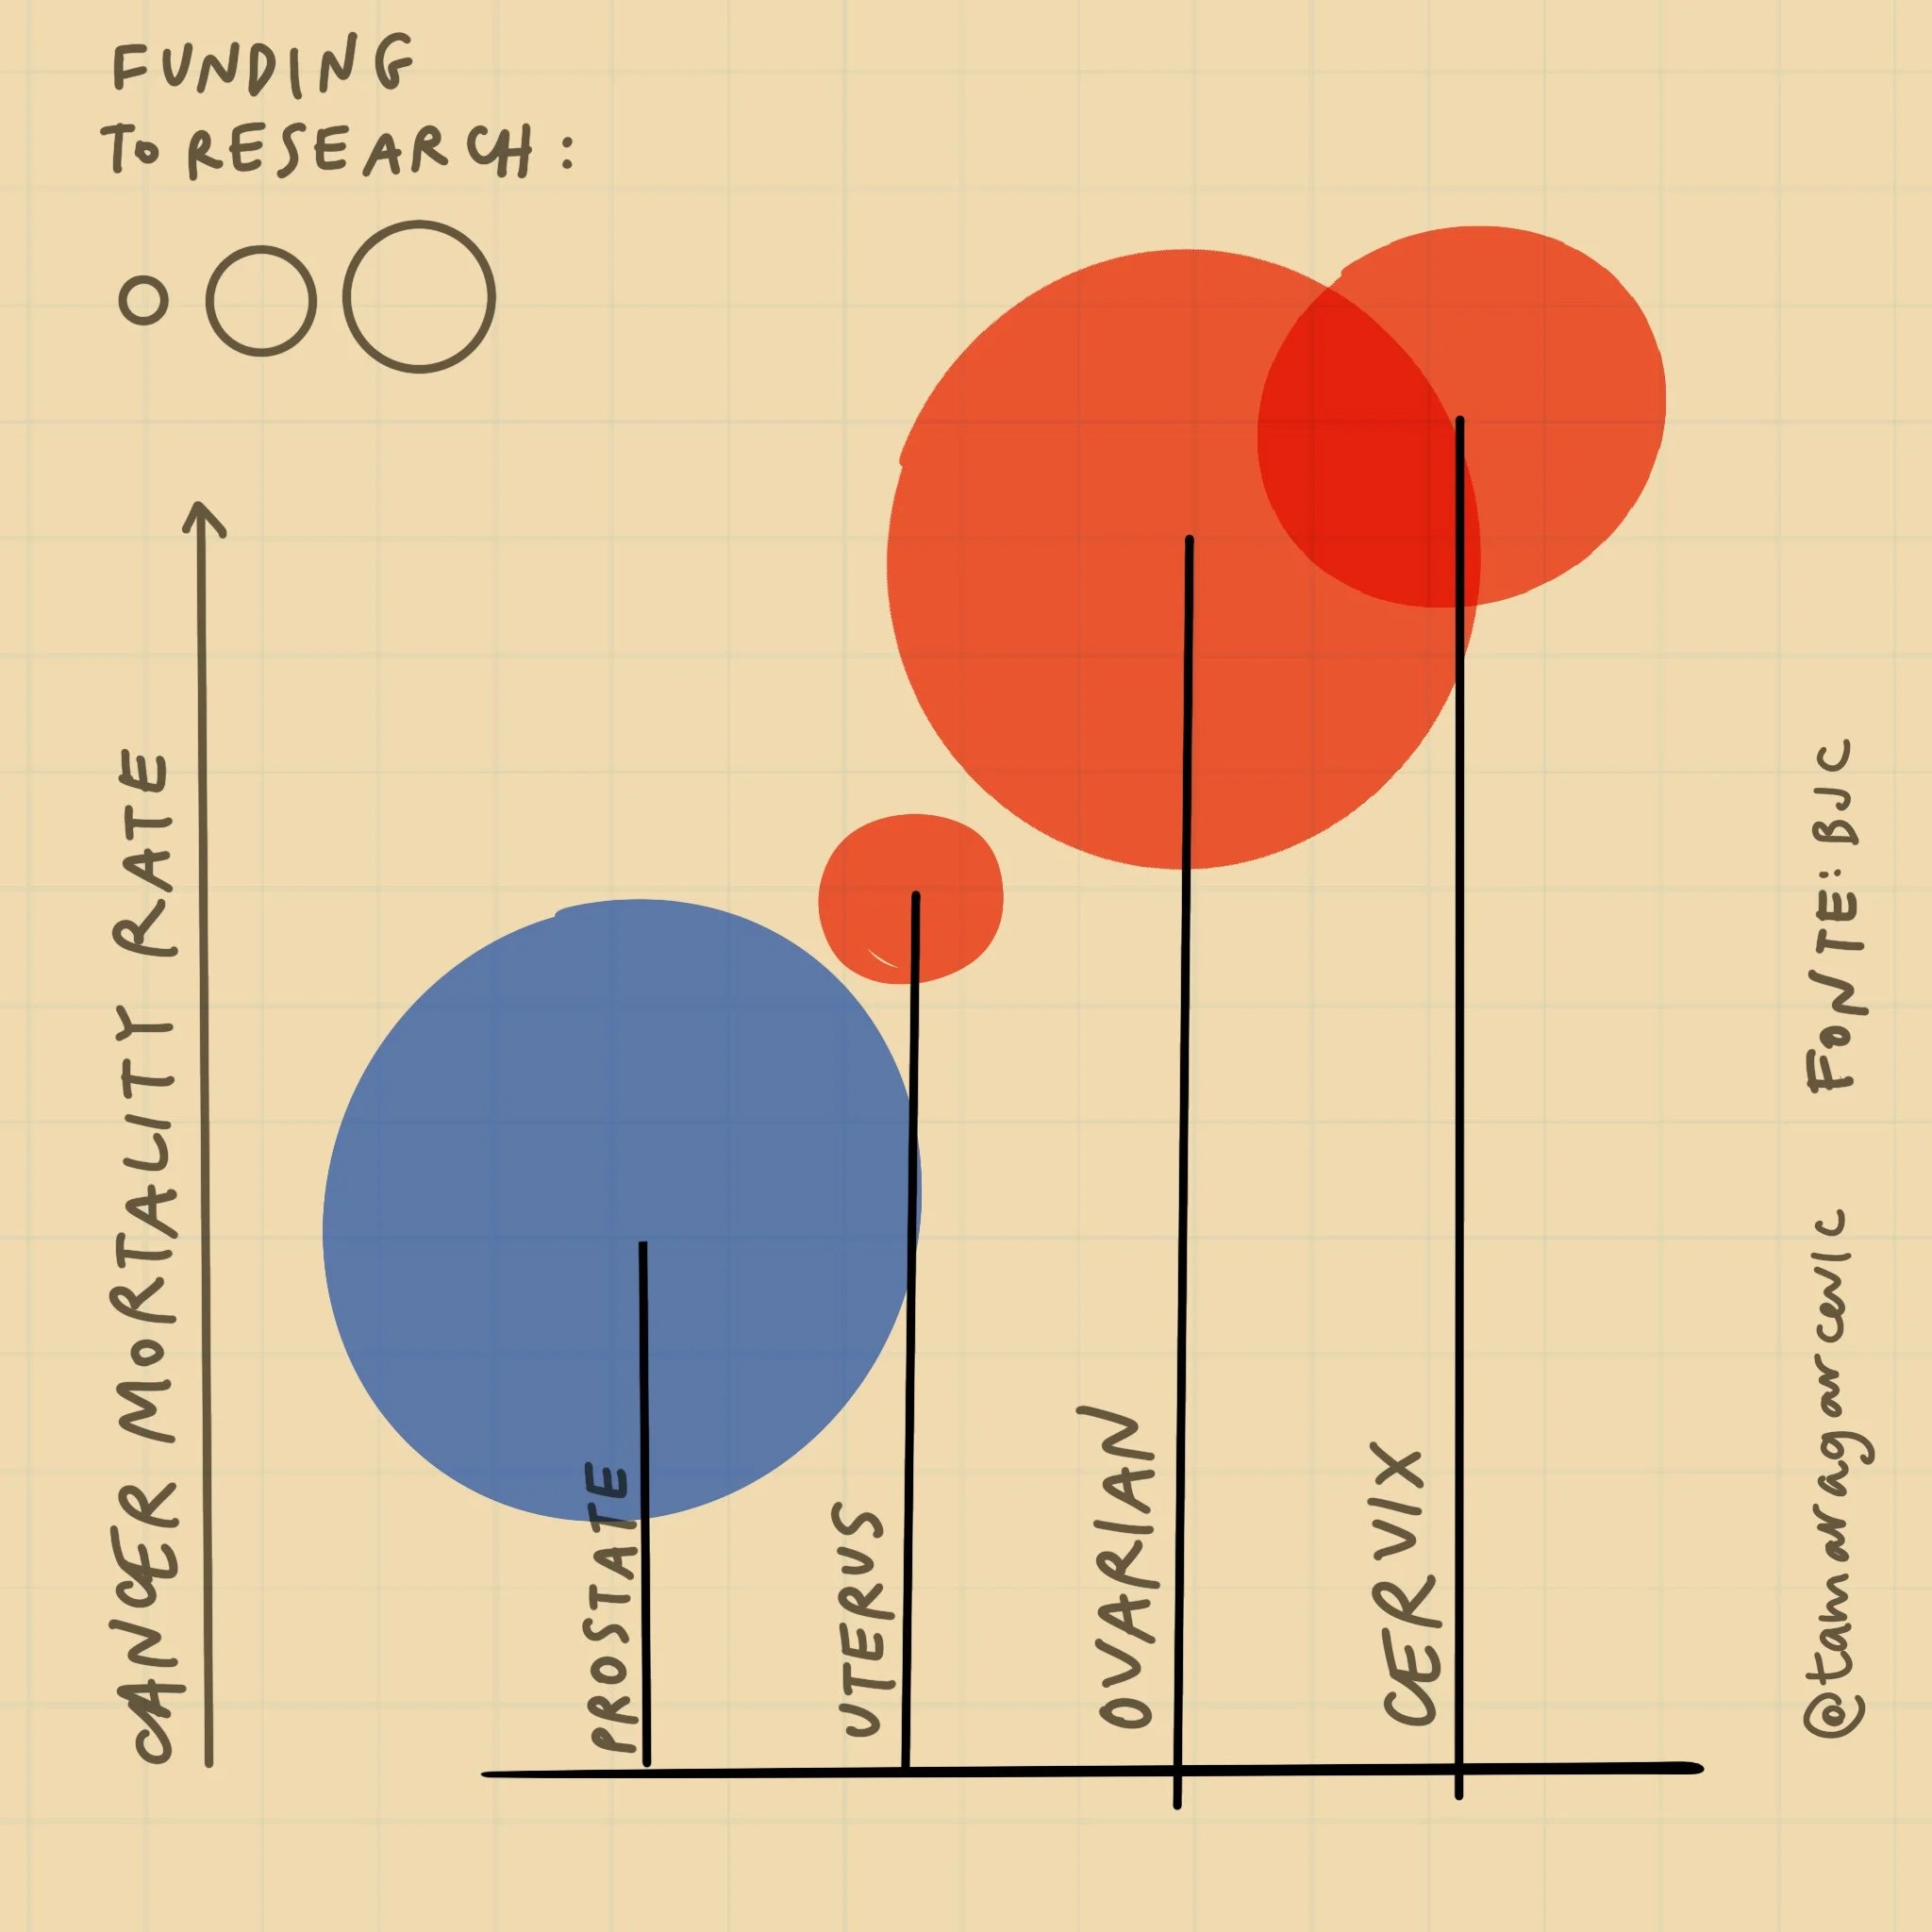
Relationship between research funding and mortality rate of reproductive system cancers.

funding: size of the dots, red for female and blue for male diseases
mortality rate:
lenght of the black line

Research and design (2023)
Source: BJC